C-terminal fragment (509-716) of the Methoprene-tolerant protein from Drosophila melanogaster
Data type: SASBDB experimental dataStatus: PublishedCurve type: Single concentrationLast updated: 2023-06-21T07:56:39.492710+02:00
Modelling of the MetC low resolution structure was performed using Ensemble Optimization Method (EOM), of which selected models are displayed in this entry. The full results obtained from EOM modelling that includes the optimised Rg and size distributions of the MetC ensemble are included in the full entry zip archive.
Note: The C-terminal fragment of the MetC protein (residues 509-716) has nine additional amino acids (GSGGIEGRH) at the N-terminus derived from the affinity tag encoded in the pColdTF expression plasmid (remaining after protease cleavage). The molecular weight (from I(0)) was calculated from the SAXS data by scaling the intensities by 0.3 in order to match the high-q scattering intensities obtained from a BSA standard. This procedure was done because estimating the concentration the MetC sample is prone to significant errors as a consequence of the protein's poor extinction coefficient (Abs. 280 nm 1mg/ml = 0.130).
▼
1. Samples, Components and Experimental Conditions Sample & Experiment
Sample 1 · C-terminal fragment (509-716) of the Methoprene-tolerant protein from Drosophila melanogaster
5. Experiment Description and Publication Experiment & Publication
Original Experiment Description
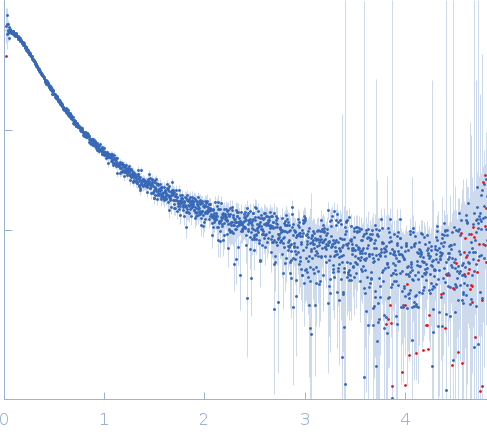
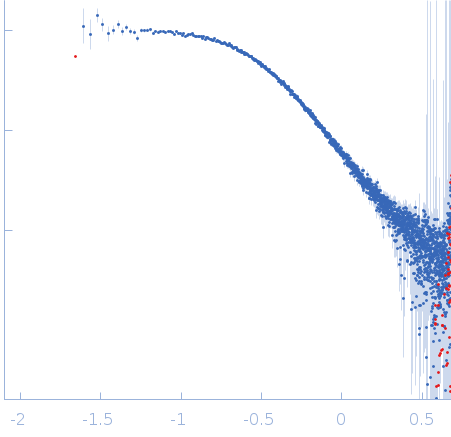
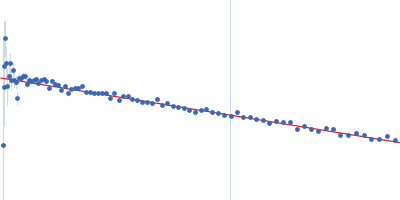
Synchrotron SAXS data from solutions of the C-terminal fragment (509-716) of the Methoprene-tolerant protein from Drosophila melanogaster in 20mM Tris/HCl, 150mM NaCl, pH 7.5 were collected on the P12 beam line at Petra-III (Hamburg, Germany) using a Pilatus 2M detector at a wavelength of λ = 0.124 nm (I(s) vs s where s = 4π sin θ/λ and 2θ is the scattering angle). One solute concentration of 2.60 mg/ml was measured. 20 successive 0.500 second frames were collected. The data were normalized to the intensity of the transmitted beam and radially averaged; the scattering of the solvent-blank was subtracted and the data scaled to protein concentration. The low angle data collected were obtained from a single concentration scattering curve.
Related Publication
Title
Intrinsic Disorder of the C-Terminal Domain of Drosophila Methoprene-Tolerant Protein.
Authors
Kolonko M, Ożga K, Hołubowicz R, Taube M, Kozak M, Ożyhar A, Greb-Markiewicz B
DOI / PMID
10.1371/journal.pone.0162950 / 27657508
▼
6. Complete Source Record Complete Source Record
The following content comes directly from the SASBDB entry. Missing values are shown as “—”; SAXSdb does not infer undeclared units.
Modelling of the MetC low resolution structure was performed using Ensemble Optimization Method (EOM), of which selected models are displayed in this entry. The full results obtained from EOM modelling that includes the optimised Rg and size distributions of the MetC ensemble are included in the full entry zip archive.
Note: The C-terminal fragment of the MetC protein (residues 509-716) has nine additional amino acids (GSGGIEGRH) at the N-terminus derived from the affinity tag encoded in the pColdTF expression plasmid (remaining after protease cleavage). The molecular weight (from I(0)) was calculated from the SAXS data by scaling the intensities by 0.3 in order to match the high-q scattering intensities obtained from a BSA standard. This procedure was done because estimating the concentration the MetC sample is prone to significant errors as a consequence of the protein's poor extinction coefficient (Abs. 280 nm 1mg/ml = 0.130).
experiment_description
Synchrotron SAXS data from solutions of the C-terminal fragment (509-716) of the Methoprene-tolerant protein from Drosophila melanogaster in 20mM Tris/HCl, 150mM NaCl, pH 7.5 were collected on the P12 beam line at Petra-III (Hamburg, Germany) using a Pilatus 2M detector at a wavelength of λ = 0.124 nm (I(s) vs s where s = 4π sin θ/λ and 2θ is the scattering angle). One solute concentration of 2.60 mg/ml was measured. 20 successive 0.500 second frames were collected. The data were normalized to the intensity of the transmitted beam and radially averaged; the scattering of the solvent-blank was subtracted and the data scaled to protein concentration. The low angle data collected were obtained from a single concentration scattering curve.