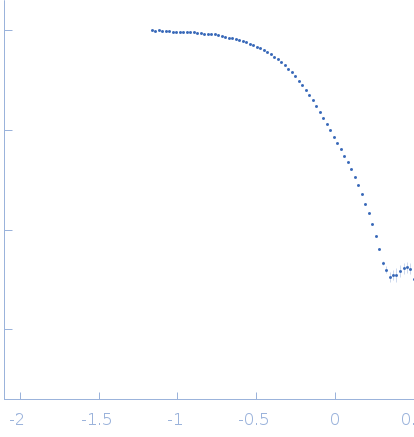
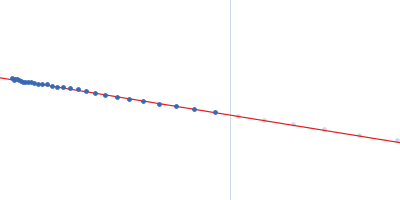
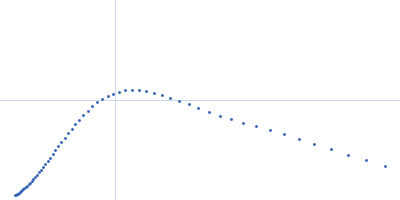
2. Measurements Reported by SASBDB Reported Results
Metric
Method
Value
Uncertainty
Unit
dmax
P(r)
13.6
0.1
Å
i0
Guinier
1.01
0.001
arbitrary
i0
P(r)
1.01
0.001
arbitrary
mw
Experimental
67.0
—
kDa
mw
Porod
67.0
—
kDa
porod_volume
Porod
100.5
—
ų
rg
Guinier
3.37
0.008
Å
rg
P(r)
3.43
0.01
Å
These values are reported by SASBDB; SAXSdb did not recalculate them from the experimental curve.
▼
3. Source Fits and Models Source Fits & Models
This entry has no source fit record.
▶
4. Source File Index Source Files
Category
Path
Download status
Size
curve
sasbdb/entries/n7/sasdcn7/source/SASDCN7.dat
downloaded
2344
full_entry_zip
sasbdb/entries/n7/sasdcn7/source/SASDCN7.zip
downloaded
4771
pddf
sasbdb/entries/n7/sasdcn7/source/SASDCN7.out
downloaded
12421
sascif
sasbdb/entries/n7/sasdcn7/source/SASDCN7.sascif
downloaded
18234
summary
sasbdb/entries/n7/sasdcn7/source/summary.json
downloaded
6999
▶
5. Experiment Description and Publication Experiment & Publication
Original Experiment Description
This experimental profile was derived from SEC-SAXS data collected at the BioCAT Sector 18-ID beamline at the Argonne National Laboratory Advanced Photon Source using a MAR 165 CCD detector. The protein was equilibrated with a 1.2 molar excess of inositol 1,3,4,5-tetrakis phosphate (IP4), concentrated to 10 mg/ml, and injected in 0.1 ml onto a 3 ml Superdex-200 Increase column equilibrated with 20 mM Tris, pH 8.0, 150 mM NaCl, 2 mM MgCl2, 0.1% 2-mercaptoethanol, 5% glycerol, and 0.001 ml IP4. SAXS data sets were acquired with 1 s exposures at 5 s intervals during elution at a flow rate of 0.25 ml/min. Raw SAXS images were radially averaged on a log scale over the q range 0.00621-0.333 Å-1 and normalized by the incident beam intensity. The protein scattering profile was reconstructed by singular value decomposition and linear combination (SVD-LC) as described in Malaby et al. (2015) Methods for analysis of size-exclusion chromatography-small angle X-ray scattering and reconstruction of protein scattering. J Appl Crystallogr 48: 1102-1113.
Related Publication
Title
Structural Dynamics Control Allosteric Activation of Cytohesin Family Arf GTPase Exchange Factors.
Authors
Malaby AW, Das S, Chakravarthy S, Irving TC, Bilsel O, Lambright DG
DOI / PMID
10.1016/j.str.2017.11.019 / 29276036
▼
6. Complete Source Record Complete Source Record
The following content comes directly from the SASBDB entry. Missing values are shown as “—”; SAXSdb does not infer undeclared units.
This experimental profile was derived from SEC-SAXS data collected at the BioCAT Sector 18-ID beamline at the Argonne National Laboratory Advanced Photon Source using a MAR 165 CCD detector. The protein was equilibrated with a 1.2 molar excess of inositol 1,3,4,5-tetrakis phosphate (IP4), concentrated to 10 mg/ml, and injected in 0.1 ml onto a 3 ml Superdex-200 Increase column equilibrated with 20 mM Tris, pH 8.0, 150 mM NaCl, 2 mM MgCl2, 0.1% 2-mercaptoethanol, 5% glycerol, and 0.001 ml IP4. SAXS data sets were acquired with 1 s exposures at 5 s intervals during elution at a flow rate of 0.25 ml/min. Raw SAXS images were radially averaged on a log scale over the q range 0.00621-0.333 Å-1 and normalized by the incident beam intensity. The protein scattering profile was reconstructed by singular value decomposition and linear combination (SVD-LC) as described in Malaby et al. (2015) Methods for analysis of size-exclusion chromatography-small angle X-ray scattering and reconstruction of protein scattering. J Appl Crystallogr 48: 1102-1113.