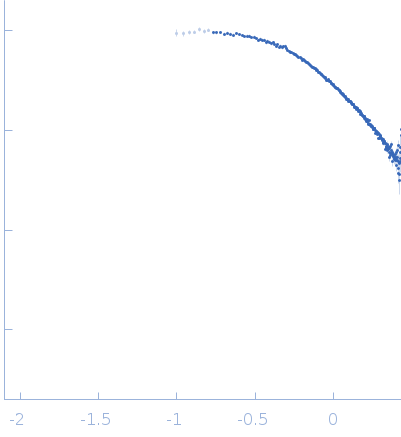
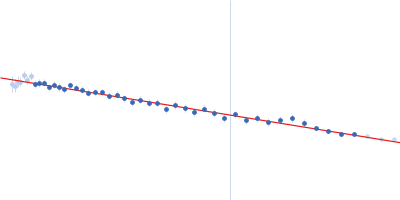
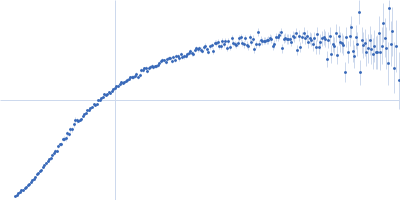
Data type: SASBDB experimental dataStatus: PublishedCurve type: Extrapolated to infinite dilutionLast updated: 2019-12-11T18:17:14.164307+01:00
▼
1. Samples, Components and Experimental Conditions Sample & Experiment
Sample 1 · Poly-adenosine rA30 in 5 mM MgCl2
Concentration
0.4 – 0.8
Buffer / pH
1 mM Na-MOPS, 20 mM NaCl, 5 mM MgCl2, 20µM EDTA / 7.0
Experimental temperature
25.0
Facility / beamline
Cornell High Energy Synchrotron Source (CHESS) / G1
Wavelength
0.11 nm
Exposure
10.0 s × 30
Molecular Components
Component
Type / organism
UniProt and Construct
Oligomeric State
Molecular weight
Poly-adenosineView sequence
AAAAAAAAAAAAAAAAAAAAAAAAAAAAAA
RNA—
——–—
monomerMolecule count 1
9.894 kDa
Experimental Curves
Curve
Points / columns
q range
Uncertainty quality
Negative-intensity points
Source file
1
261[3]
0.01–0.27 1/A
Has uncertainty columnMissing 0
0
sasbdb/entries/h9/sasdfh9/source/SASDFH9.dat
▼
2. Measurements Reported by SASBDB Reported Results
Metric
Method
Value
Uncertainty
Unit
dmax
P(r)
10.0
—
Å
i0
Guinier
27.52
0.25
—
i0
P(r)
28.27
—
—
mw
Experimental
11.0
—
kDa
porod_volume
Porod
15.0
—
ų
rg
Guinier
2.3
0.02
Å
rg
P(r)
2.52
—
Å
These values are reported by SASBDB; SAXSdb did not recalculate them from the experimental curve.
▼
3. Source Fits and Models Source Fits & Models
This entry has no source fit record.
▶
4. Source File Index Source Files
Category
Path
Download status
Size
curve
sasbdb/entries/h9/sasdfh9/source/SASDFH9.dat
downloaded
5504
full_entry_zip
sasbdb/entries/h9/sasdfh9/source/SASDFH9.zip
downloaded
8568
pddf
sasbdb/entries/h9/sasdfh9/source/SASDFH9.out
downloaded
25127
sascif
sasbdb/entries/h9/sasdfh9/source/SASDFH9.sascif
downloaded
35505
summary
sasbdb/entries/h9/sasdfh9/source/summary.json
downloaded
6033
▶
5. Experiment Description and Publication Experiment & Publication
Original Experiment Description
Synchrotron SAXS data from solutions of rA30 in 1 mM Na-MOPS, 20 mM NaCl, 5 mM MgCl2, 20µM EDTA, pH 7 were collected on the G1 beam line at the Cornell High Energy Synchrotron Source (CHESS) storage ring (Ithaca, NY, USA) using a Finger Lakes CCD detector at a sample-detector distance of 2.0 m and at a wavelength of λ = 0.11 nm (I(s) vs s, where s = 4πsinθ/λ, and 2θ is the scattering angle). Solute concentrations ranging between 0.4 and 0.8 mg/ml were measured at 25°C. 30 successive 10 second frames were collected. The data were normalized to the intensity of the transmitted beam and radially averaged; the scattering of the solvent-blank was subtracted. The low angle data collected at lower concentrations were extrapolated to infinite dilution and merged with the higher concentration data to yield the final composite scattering curve.
Related Publication
Title
Visualizing disordered single-stranded RNA: connecting sequence, structure and electrostatics.
Authors
Plumridge A, Andresen K, Pollack L
DOI / PMID
10.1021/jacs.9b04461 / 31804813
▼
6. Complete Source Record Complete Source Record
The following content comes directly from the SASBDB entry. Missing values are shown as “—”; SAXSdb does not infer undeclared units.
Synchrotron SAXS data from solutions of rA30 in 1 mM Na-MOPS, 20 mM NaCl, 5 mM MgCl2, 20µM EDTA, pH 7 were collected on the G1 beam line at the Cornell High Energy Synchrotron Source (CHESS) storage ring (Ithaca, NY, USA) using a Finger Lakes CCD detector at a sample-detector distance of 2.0 m and at a wavelength of λ = 0.11 nm (I(s) vs s, where s = 4πsinθ/λ, and 2θ is the scattering angle). Solute concentrations ranging between 0.4 and 0.8 mg/ml were measured at 25°C. 30 successive 10 second frames were collected. The data were normalized to the intensity of the transmitted beam and radially averaged; the scattering of the solvent-blank was subtracted. The low angle data collected at lower concentrations were extrapolated to infinite dilution and merged with the higher concentration data to yield the final composite scattering curve.