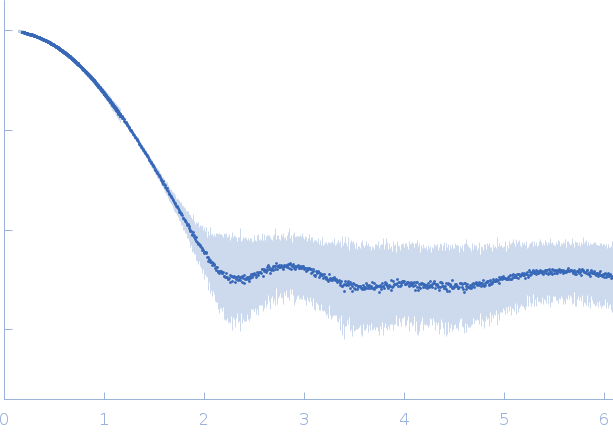
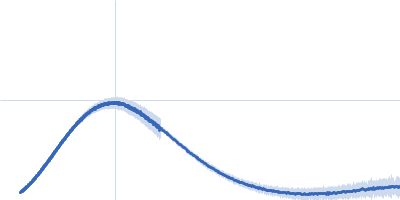
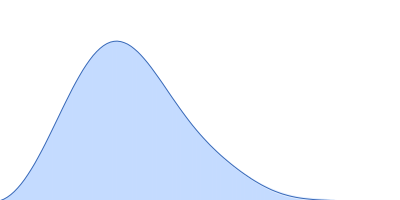
SAXS data of Fe(3,4-DHB)2-FatB were collected at two sample-to-detector distances (4 m and 1 m). The 4 m setting covered the low-q region (q ≈ 0.014 to 0.116 Å-1), and the 1 m setting covered the higher-q region (q ≈ 0.116 to 0.60 Å-1). The datasets were scaled and checked for agreement in the overlap region before merging into a single profile.
▼
1. 样品、组分与实验条件 Sample & Experiment
样品 1 · Ferric anguibactin-binding protein (FatB) in complex with the ferric catecholate ligand, Fe(3,4-DHB)2
FatB in complex with the ferric catecholate ligand, Fe(3,4-DHB)2.
experiment.sample.buffer.name
20mM Tris-HCl, 100 mM NaCl
experiment.sample.buffer.concentration_unit
null
experiment.sample.buffer.comment
null
experiment.sample.buffer.additive
null
experiment.sample.buffer.concentration
null
experiment.sample.buffer.pka
null
experiment.sample.buffer.ph
8.0
experiment.sample.buffer.deuteration
null
experiment.sample.purity_method
null
experiment.sample.name
Ferric anguibactin-binding protein (FatB) in complex with the ferric catecholate ligand, Fe(3,4-DHB)2
experiment.sample.ext_coefficient
null
experiment.sample.contrast
null
experiment.sample.specific_vol
null
experiment.sample.dry_vol
null
experiment.sample.absorbption
null
experiment.sample.deuteration
null
experiment.sample.mixture
null
experiment.contributor
[]
experiment.concentration_method
null
experiment.concentration_unit
null
experiment.date
2025-04-07
experiment.storage_temperature
4.0
experiment.cell_temperature
4.0
experiment.exposure_time
10.0
experiment.number_of_frames
50
experiment.wavelength
0.0734
experiment.sample_detector_distance
4.0
experiment.concentration_min
null
experiment.concentration_max
3.0
experiment.sample_volume
null
experiment.flow_rate
null
experiment.s_min
0.148
experiment.s_max
6.088
experiment.total_exposure_time
null
experiment.seccolumn
null
fits
[]
estimated_volume_method
null
pddf_software
ATSAS GNOM
pddf_software_version
5.0
i0_calibration_standard
null
description
SAXS data of Fe(3,4-DHB)2-FatB were collected at two sample-to-detector distances (4 m and 1 m). The 4 m setting covered the low-q region (q ≈ 0.014 to 0.116 Å-1), and the 1 m setting covered the higher-q region (q ≈ 0.116 to 0.60 Å-1). The datasets were scaled and checked for agreement in the overlap region before merging into a single profile.