2. Measurements Reported by SASBDB Reported Results
Metric
Method
Value
Uncertainty
Unit
dmax
P(r)
18.3
1.0
Å
i0
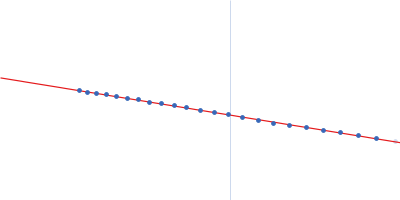
Guinier
3011.44
11.0
—
i0
P(r)
3033.0
5.5
—
mw
Experimental
251.0
—
kDa
porod_volume
Porod
308.0
—
ų
rg
Guinier
5.2
0.02
Å
rg
P(r)
5.41
0.008
Å
These values are reported by SASBDB; SAXSdb did not recalculate them from the experimental curve.
▼
3. Source Fits and Models Source Fits & Models
This entry has no source fit record.
▶
4. Source File Index Source Files
Category
Path
Download status
Size
curve
sasbdb/entries/27/sasdb27/source/SASDB27.dat
downloaded
22247
full_entry_zip
sasbdb/entries/27/sasdb27/source/SASDB27.zip
downloaded
16647
pddf
sasbdb/entries/27/sasdb27/source/SASDB27.out
downloaded
40408
sascif
sasbdb/entries/27/sasdb27/source/SASDB27.sascif
downloaded
59238
summary
sasbdb/entries/27/sasdb27/source/summary.json
downloaded
7715
▶
5. Experiment Description and Publication Experiment & Publication
Original Experiment Description
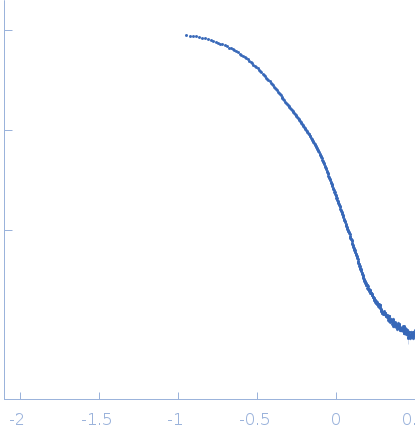
Synchrotron SAXS data from solutions of a chimeric EcRHH-RcPutA protein fusion in 50 mM Tris, 200 mM NaCl, 0.5 mM Tris(3-hydroxypropyl)phosphine, pH 7.5 were collected on the 12.3.1 (SIBYLS) camera on the storage ring Advanced Light Source (ALS) (Berkeley, CA, USA) using a MAR 165 CCD detector at a sample-detector distance of 1.5 m and at a wavelength of λ = 0.1 nm (I(s) vs s, where s = 4π sin θ/λ and 2θ is the scattering angle). A solute concentrations of 6 mg/ml was measured at 20°C. The data were normalized to the intensity of the transmitted beam and radially averaged; the scattering of the solvent-blank was subtracted. The merged SAXS curve displayed in this entry was obtained by merging the low-s region (points 2-140, s=0.1125 — 0.9517 nm-1) from an image collected with an exposure time of 0.5 s with the higher-s region (points 19-505, s=0.2159 — 3.1710 nm-1) of a profile collected with exposure time of 2.0 s. The errors in PDDF Rg and I0 were estimated by running GNOM via primus/qt (r4556) assuming Dmax in the range of 173-193 and using all points of the scattering curve (1-503).
Related Publication
Title
Engineering a trifunctional proline utilization A chimaera by fusing a DNA-binding domain to a bifunctional PutA.
Authors
Arentson BW, Hayes EL, Zhu W, Singh H, Tanner JJ, Becker DF
DOI / PMID
10.1042/BSR20160435 / 27742866
▼
6. Complete Source Record Complete Source Record
The following content comes directly from the SASBDB entry. Missing values are shown as “—”; SAXSdb does not infer undeclared units.
Synchrotron SAXS data from solutions of a chimeric EcRHH-RcPutA protein fusion in 50 mM Tris, 200 mM NaCl, 0.5 mM Tris(3-hydroxypropyl)phosphine, pH 7.5 were collected on the 12.3.1 (SIBYLS) camera on the storage ring Advanced Light Source (ALS) (Berkeley, CA, USA) using a MAR 165 CCD detector at a sample-detector distance of 1.5 m and at a wavelength of λ = 0.1 nm (I(s) vs s, where s = 4π sin θ/λ and 2θ is the scattering angle). A solute concentrations of 6 mg/ml was measured at 20°C. The data were normalized to the intensity of the transmitted beam and radially averaged; the scattering of the solvent-blank was subtracted. The merged SAXS curve displayed in this entry was obtained by merging the low-s region (points 2-140, s=0.1125 — 0.9517 nm-1) from an image collected with an exposure time of 0.5 s with the higher-s region (points 19-505, s=0.2159 — 3.1710 nm-1) of a profile collected with exposure time of 2.0 s. The errors in PDDF Rg and I0 were estimated by running GNOM via primus/qt (r4556) assuming Dmax in the range of 173-193 and using all points of the scattering curve (1-503).